by Ryan Evans
Oct 17 '18
If you ran video ads on Facebook in the last few years, Facebook has been lying to you.
In July 2015, several advertisers questioned Facebook about video view metrics that seemed a little, umm, shady. It turns out those advertisers were right. Facebook disclosed that the average viewership metrics were inflated by 60%–80%.
But that's not the end of the story. A new class-action lawsuit claims that the video analytics numbers were actually inflated by 150% - 900%. Worse yet, Facebook didn't disclose the "miscalculation" for over a year after they found out about it.
Here's an excerpt from the class action lawsuit:
In June 2016, a Facebook engineering manager finally followed up on advertiser complaints dating back to early 2015, writing that "[s]omehow there was no progress on the task for a year." But even once it was decided to take action on the metrics, Facebook did not promptly fix its calculation or disclose that the calculation was wrong. Instead, it continued reporting miscalculated viewership metrics for another several months, as it developed a "no PR" strategy to avoid drawing attention to the error. The company decided to "obfuscate the fact that we screwed up the math" by quietly retiring the erroneous metrics and replacing them with corrected metrics under a new name. For instance, Average Duration of Video Viewed would be replaced with Average Watch Time.
In August 2016, Facebook began reaching out privately to select, large advertisers, telling them that Facebook had "recently discovered a discrepancy" in the video ad average view metrics. Facebook pushed that message even as personnel internally emphasized that "we didn't recently discover a discrepancy." (emphasis added).
In 2017, Facebook made $40B in revenue. Most of that money is spent based on pure faith. For advertisers, the Facebook story isn't just compelling, it's gospel. Facebook has built the largest audience in the history of the world. Their ad tools and ad formats are incredible and they have rich data on every single user. But that data and their metrics aren't perfect.
Here are a few other ways Facebook's metrics and data can lead you astray:
Click fraud
It's really hard to quantify how much of a problem click fraud is for Facebook, but it exists. Shady operations create fake Facebook users or bots to inflate the number of likes company pages have and artificially promote other content. Part of that process includes clicking on ads.
Accidental clicks
On a phone, my big fat thumbs are always finding their way onto sites I didn't want to visit. I can't tell you how many times I've scrolled or swiped myself onto someones' site accidentally. This is a double whammy because not only does it throw your metrics off, but it also distorts what audience Facebook places me in.
Bad audience data
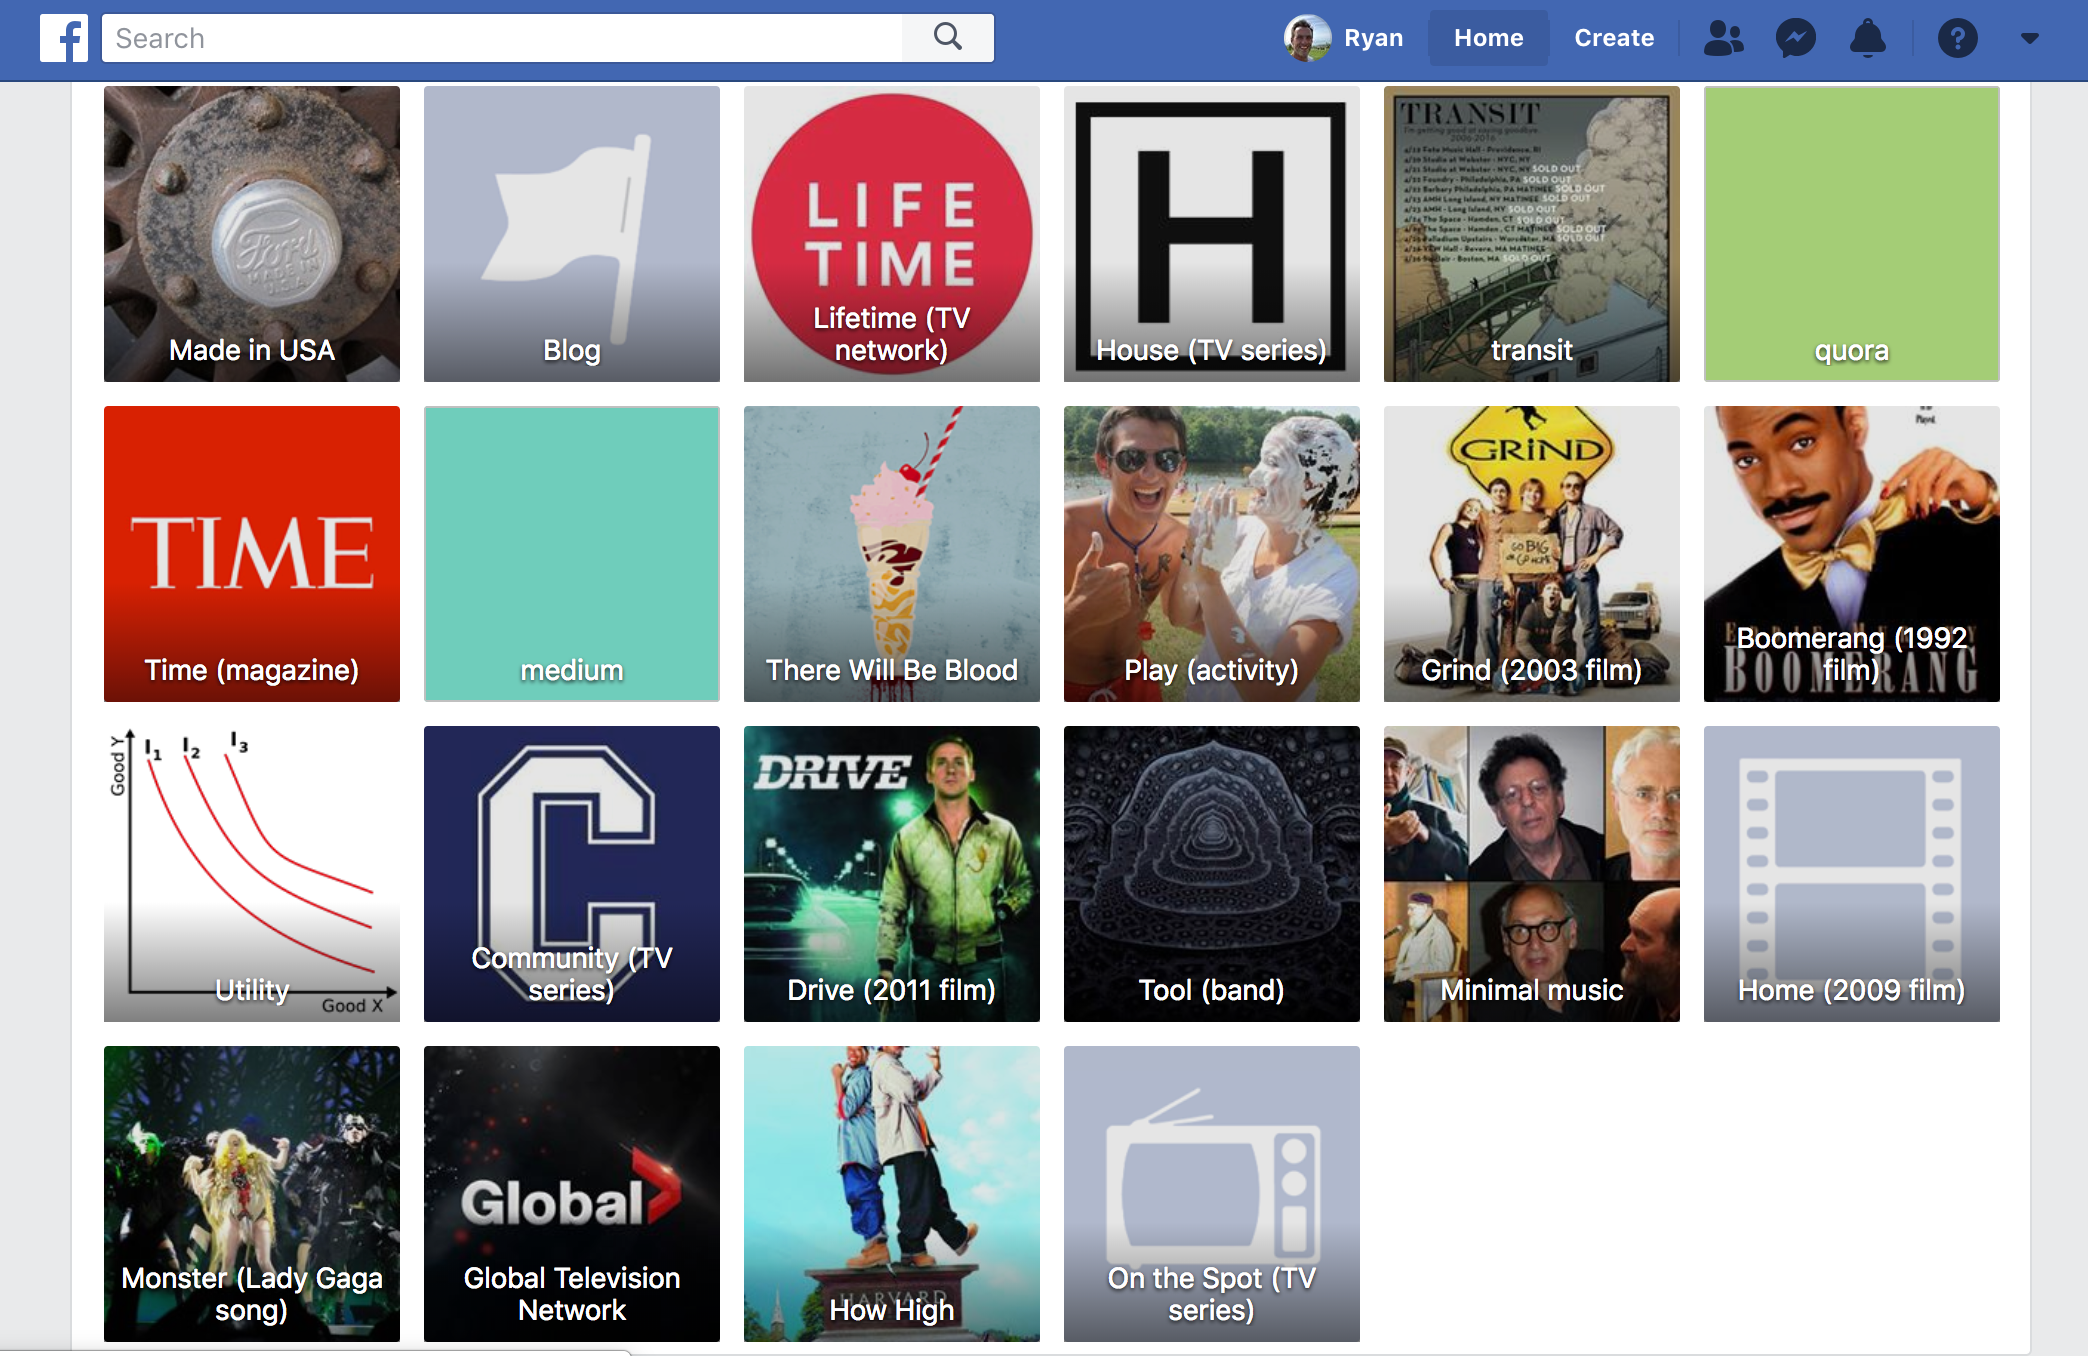
Facebook's user data is probably the best there is out there. But it's far from perfect. If you want to take a look at how well Facebook targets you, click on your ad preferences page.
It's a combination of creepy and hilarious. Facebook has a lot right about me, but on this page, almost nothing is right. Sure, I love the movie "There Will be Blood" and I use Quora sometimes but other than that they got almost everything wrong. Boomerang? C'mon Facebook you know me better than that.
Confusing metric names
Sometimes a metric you think means one thing means something quite different. The best example of this is "clicks". Most people assume that clicks are defined as the number of times someone clicked on the ad and were directed to your website.
Here's how Facebook defines clicks:
Clicks - The metric counts multiple types of clicks on your ad, including certain types of interactions with the ad container, links to other destinations, and links to expanded ad experiences. It includes:
- Link clicks
- Clicks to the associated business Page profile or profile picture
- Post reactions (such as likes or loves)
- Comments or shares
- Clicks to expand media (such as photos) to full screen
- Clicks to take actions identified as your campaign objective (such as liking your Page for a Page engagement campaign)
Metrics overload
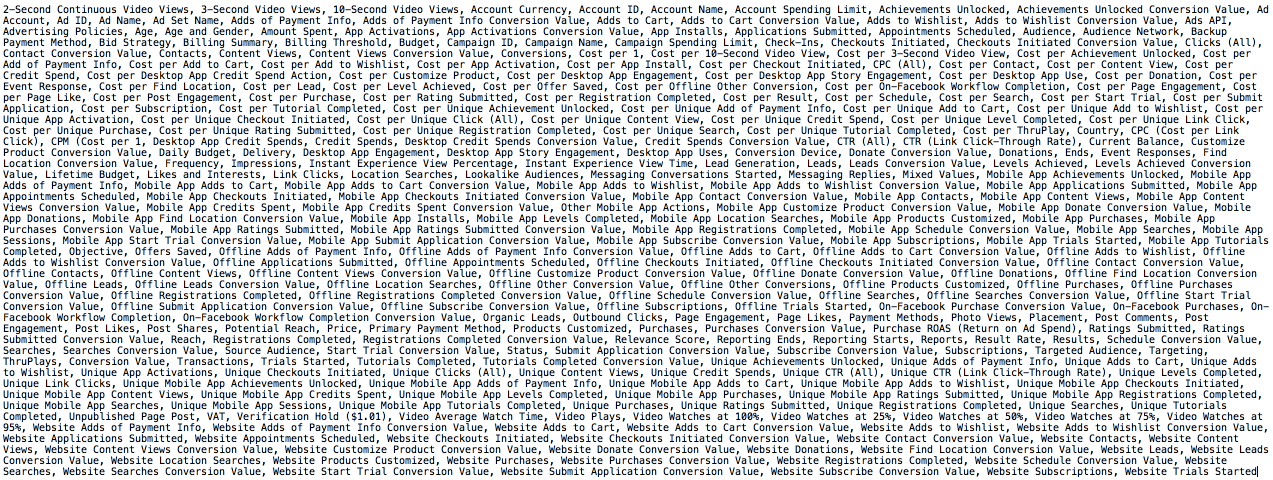
Most advertisers don't know if Facebook's ads really drive sales. That lack of knowledge isn't from a shortage of data. Facebook's ad reports have so many graphs, reports, and metrics that you feel like you're running the federal reserve. Seriously, here is a screenshot of their metrics:
I don't think Facebook intentionally cranks out metrics with the sole intention of distracting advertisers, but it does have that effect. With all those dots, how can you not connect them?
"Hmmm...I don't know how many customers we got, but boy our cost per unique achievements unlocked is so cheap and we're crushing the website ads to wishlist numbers."
I'm not here to tell you Facebook ads don't work. Facebook wouldn't be one of the most successful businesses in history if they didn't and you should try Facebook ads if it's a fit for your business.
But if you want to know if Facebook's ads are worth it, don't rely on Facebook to tell you.
Subscribe to our Newsletter